- Local time
- 4:45 PM
- User ID
- 319
- Joined
- Dec 29, 2015
- Messages
- 9,637
- Reaction score
- 63,563
- Location
- Strong Island NY
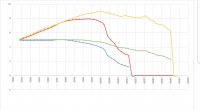
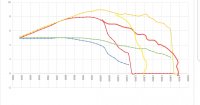
Interesting.The dip is because yours was still extra rich. Both saws were tuned at 14k ish
Ranchdad was prolly around the 13.8k cfb was prolly 14.3k
More of a gradual quick "clean up" with the leaner tunes. Where the ranchdad still had a hard 4 stroke until clean up. The dip means nothing other than it was still rich at those rpm.
I cannot "see" what the curve will look like. Looking at the raw data scrolling across the screen. Just any crazy anomalies, or missing chunks of data. As long as I don't see those, and have a smooth run. I take it home and graph it.
My thoughts are as long as I have a couple thousand rpm of down slope from peak hp it shows the "powerband". No matter how lean/rich it is tuned those peak numbers don't seem to change.
Now with the screamers, 15k+ those shoe real well on the top end of the graph, as they already have a good load by 14k (where the graph starts) they look good. But the peaks are still the same. Long as the tune isn't so rich to be under peak hp rpm.
I would fully expect your saw to start pulling away at the 12k+ mark. Still going to need around 15k+ to show the top end well.
It would be fair to use the cfb curve and replace your "dip" from the 11.5k to the 14k where yours is pulling a bit harder.
If that makes sense.
So you see little change in peak power regardless of tune? The curve will change but the peak won’t?


