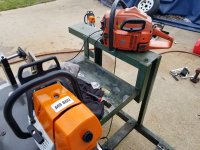
Awesome job on both the dyno and the saw, very impressive!
However, the auditor in me has to ask a question. Why is 8.18 below the 8 line on the graph, and likewise 7.2 below the 7 line? Shouldn't they both be a bit above those marks??? Seems like the graph is not perfectly mated to the grid.
Your dyno is awesome not for just showing the peak power of the saw, but also for showing the broadness of the power curve. Very important (IMO) for both work saws and for milling.
I sure wish you lived closer, lots of things I'd like to test! (Various saws, various air filters, various mufflers, etc).
The graphs aren't perfectly mated.
My grid is every 100 rpm and some it skips. The graphs are every 250 rpm. Tried to match it close.
Over those 2 runs it picked 1800, and 2700 data samples.
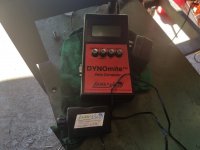
I am working on getting the actual software's to do the graphs.
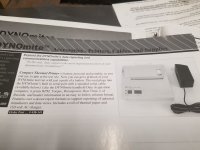
Even the printer to actually print the grid in order would be super helpful.
People were wanting to see an actual graph, so I tried my best to match it up with the data points.


