High Quality Chainsaw Bars Husqvarna Toys Hockfire Saws

Husqvarna 350 comparison video with cut times!

Mattyo

Youtube speciawist
GoldMember
Local time
10:43 AM
User ID
441
Joined
Jan 8, 2016
Messages
4,285
Reaction score
10,915
Location
Farmington, CT
Country flag
It didn't outcut the ported 350's, but really hung well with them, so much so that I'm really questions why bother with the porting. The question is why, especially with such a low comp #. I don't really know if we will be able to detangle the mystery.
 

beaglebriar

The Peanut Gallery
GoldMember
Local time
10:43 AM
User ID
377
Joined
Jan 1, 2016
Messages
18,949
Reaction score
107,398
Location
Warren Center, PA
Country flag
I have a bone stock 2150 that runs pretty strong. I should compare it to my 353 just for the heck of it.
 

Mattyo

Youtube speciawist
GoldMember
Local time
10:43 AM
User ID
441
Joined
Jan 8, 2016
Messages
4,285
Reaction score
10,915
Location
Farmington, CT
Country flag
OK..... PLEASE PLEASE PLEASE tell me I get a prize for this....

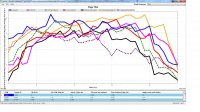
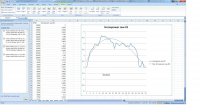
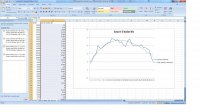
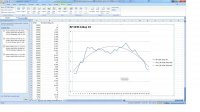
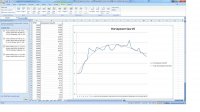
this took about 3 hours to make.... some of this data is INTERPOLATED BY ME... not necessarily RAW. Excel will not plot overlays like this, so I had to import RAW data into excel, create data points where they didn't exist (for instance, HP/torque is not necessarily measured at every 250 rpm interval) so I had to complete the data so it ended up not just being correct looking, but also had an appropriate RPM range for all 7 saws. ie, some saws went from 12.5k to 500rpm wheras some only had data from 13.5 to 5000 rpm or so.... you get the idea. anywho... I took the RAW DATA in excel, plotted a 2nd or 3rd order polynomial trendline on it, whichever seemed to match better, then when I added data point I made sure it didn't mess with the trendline too much....ie...I'm not adding data on a COMPLETELY random basis...its at least slightly objective data even if it is interpolated. the really cruddy thing is that I CANNOT export the 2nd order poly data from excel. I can photograph my work in excel, by taking screenshots, but there is no "raw data" from a trendline available. sorry.

anyway, without further adieu....
compilation PIC on DAT PLOT 7 saws!.jpg


@wcorey
@malk315
 
Last edited:

paragonbuilder

Mastermind Approved!
Local time
10:43 AM
User ID
384
Joined
Jan 2, 2016
Messages
9,229
Reaction score
33,867
Location
Norwich, CT
Country flag
OK..... PLEASE PLEASE PLEASE tell me I get a prize for this....

this took about 3 hours to make.... some of this data is INTERPOLATED BY ME... not necessarily RAW. Excel will not plot overlays like this, so I had to import RAW data into excel, create data points where they didn't exist (for instance, HP/torque is not necessarily measured at every 250 rpm interval) so I had to complete the data so it ended up not just being correct looking, but also had an appropriate RPM range for all 7 saws. ie, some saws went from 12.5k to 500rpm wheras some only had data from 13.5 to 5000 rpm or so.... you get the idea. anywho... I took the RAW DATA in excel, plotted a 2nd or 3rd order polynomial trendline on it, whichever seemed to match better, then when I added data point I made sure it didn't mess with the trendline too much....ie...I'm not adding data on a COMPLETELY random basis...its at least slightly objective data even if it is interpolated. the really cruddy thing is that I CANNOT export the 2nd order poly data from excel. I can photograph my work in excel, by taking screenshots, but there is no "raw data" from a trendline available. sorry.

anyway, without further adieu....
View attachment 21833


@wcorey
@malk315
Wow! Matt that was a lot of work!
 

Tor R

Novice
GoldMember
Local time
4:43 PM
User ID
439
Joined
Jan 8, 2016
Messages
5,615
Reaction score
37,322
Location
Mandal
Country flag
anyway, without further adieu....
compilation-pic-on-dat-plot-7-saws-jpg.21833
nice work Matt.
This is how I would like to see the dyno result, even fools like me can understand it
 

malk315

Running Saws for Therapy
Local time
10:43 AM
User ID
421
Joined
Jan 6, 2016
Messages
2,101
Reaction score
10,140
Location
Lancaster, MA
Country flag
OK..... PLEASE PLEASE PLEASE tell me I get a prize for this....

this took about 3 hours to make.... some of this data is INTERPOLATED BY ME... not necessarily RAW. Excel will not plot overlays like this, so I had to import RAW data into excel, create data points where they didn't exist (for instance, HP/torque is not necessarily measured at every 250 rpm interval) so I had to complete the data so it ended up not just being correct looking, but also had an appropriate RPM range for all 7 saws. ie, some saws went from 12.5k to 500rpm wheras some only had data from 13.5 to 5000 rpm or so.... you get the idea. anywho... I took the RAW DATA in excel, plotted a 2nd or 3rd order polynomial trendline on it, whichever seemed to match better, then when I added data point I made sure it didn't mess with the trendline too much....ie...I'm not adding data on a COMPLETELY random basis...its at least slightly objective data even if it is interpolated. the really cruddy thing is that I CANNOT export the 2nd order poly data from excel. I can photograph my work in excel, by taking screenshots, but there is no "raw data" from a trendline available. sorry.

anyway, without further adieu....
View attachment 21833


@wcorey
@malk315
As I said in the PM Matt this is awesome. IMHO your 2 saws are right there with the Brad saw and yours smoked the murder 346 in wood test you and I did. Well done and I'm psyched you got it done ... I was gonna dig in tonight but you need no help from me!

Sent from my XT1080 using Tapatalk
 
Top